

With QA Vector Analytics (QAVA), test and quality assurance teams can independently benchmark the performance of your development and testing environments and uncover the long term trends of business-level changes, such as the introduction of a testing centre of excellence, or the wide scale adoption of a new vendor tool.
The core QAVA scores are execution, spend, and efficiency (a proxy for RoI).
Through a weighted scorecard of key indicators, including time and money spent in development, test, and remediation (work in production), alongside development overruns and defect escape rates, QAVA scores hundreds of projects from a customer bank, providing independent feedback on the effectiveness of ongoing schemes.
In the example picture, a large anonymised bank is shown undergoing a transformation programme that begins in mid-2019.
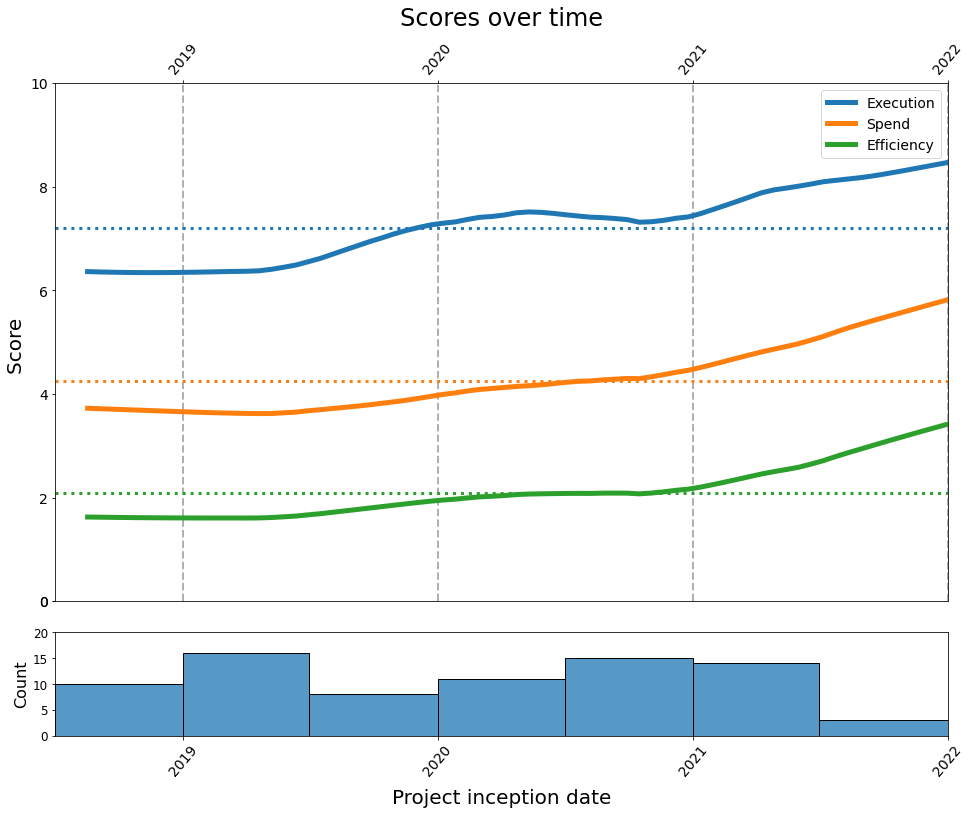
Improvements to overall project health can be seen almost immediately, but the execution score levels off after a year as project teams begin using their own tools and fall back into old ways that lead to project overruns and higher defect escape rates. By recognising this lull, the transformation team are able to respond and the score begins to increase again.
The firm continually improves its spending score, with less spent in testing and remediation than ever before. Combined with the increases in execution score, the average efficiency at the bank has doubled by the end of 2022.
QA Vector Analytics benchmarks testing teams in efficiency against historical and market data. Contact info@qa-financial.com for more information.
Scores shown are synthetic and for demonstration purposes only.